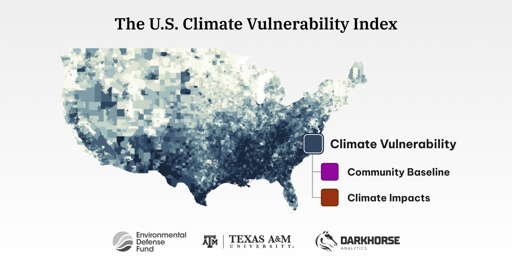
Pulling in 184 sets of data to rank more than 70,000 U.S. Census tracts, the U.S. Climate Vulnerability Index helps you see which communities face the greatest challenges from the impacts of a changing climate. This tool shows what is driving the challenges, so policymakers and communities themselves can take action to build climate resilience where it is needed most.
Not too sure how accurate this is. Wine country in California is designated in the low 10% overall, but got absolutely ravaged by climate driven wildfires over the last few years. The impact has been very apparent here - 90’ fire tornadoes make an impression.
I agree. I posted a bunch of links in this community today, as I think it’s important to look at several different sources for climate risk (especially if you’re seriously considering moving.) IMO the best source for risk data is First Street, but as a member of the public you can only query their risk database, not look at it as a whole. I looked into buying their bulk data to make a map like this but it starts at $10,000/year, and that’s about 1/4 of my take-home income right now. Their national risk reports are a good resource though.


