
- cross-posted to:
- space@lemmy.world
- cross-posted to:
- space@lemmy.world
In this video Anton Petrov talks about the ultimate logarithmic graph ever made - the one showing us everything in the universe. It discusses a recent publication “All objects and some questions” from Am. J. Phys. 91, 819–825 (2023) https://doi.org/10.1119/5.0150209
You must log in or register to comment.
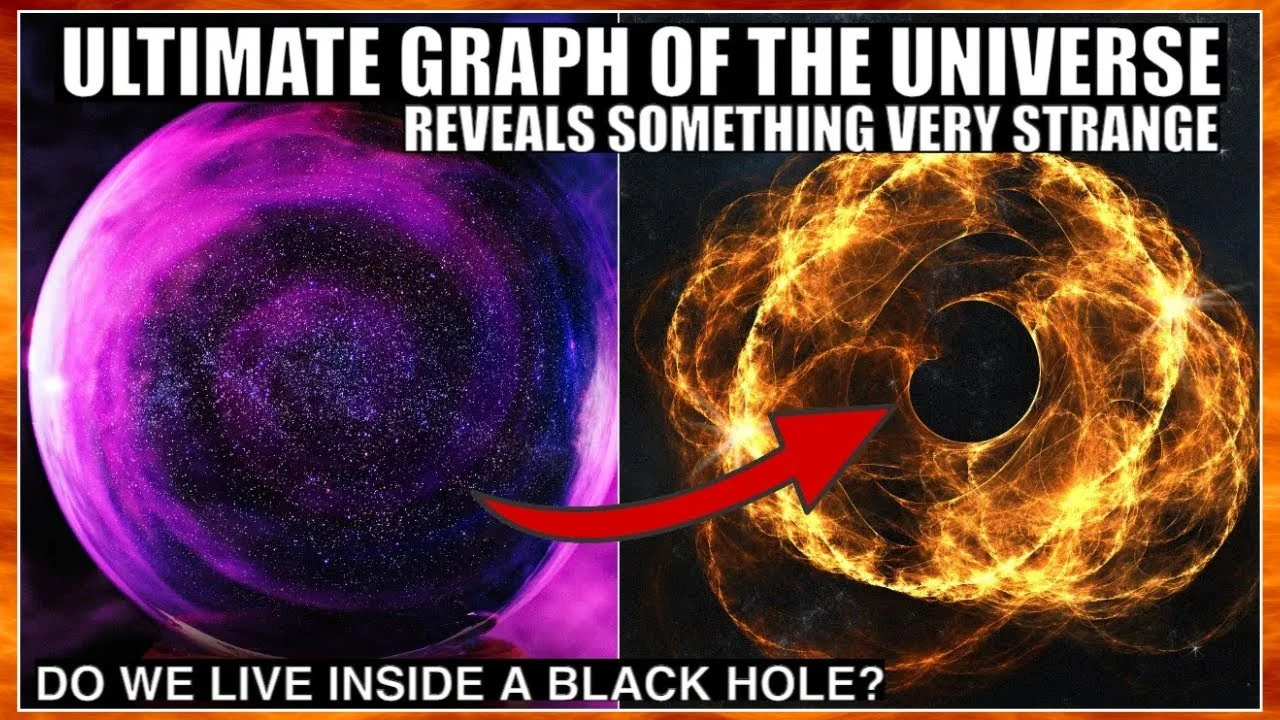
Here’s the graphs of all objects in the universe.
Here’s the figure legend: Masses, sizes, and relative densities of objects in our Universe. Time-dependent background densities are color-coded as in Fig. 1. The diagonal white dashed isodensity lines correspond to the intersections in Fig. 1 of the vertical isochron lines with the black density line. Gravity and quantum uncertainty prevent objects of a given mass from being smaller than their corresponding Schwarzschild radius [Eq. (6)] or Compton wavelength [Eq. (7)]. Schwarzschild black holes lie on the black m∝r diagonal line which is the lower boundary of the “forbidden by gravity” region. The masses and Compton wavelengths of the top quark (t), Higgs boson (Ho), proton (p), electron (e), and neutrinos (ν) are plotted along the Compton (m∝r−1) diagonal line. Among these, the top quark has the smallest Compton wavelength, because it has the largest mass: 173GeVc−2. The smallest possible object is a Planck-mass black hole indicated by the white dot labeled “instanton” (Ref. 20). Its mass and size are (m,r)=(mp,lp). The smallest observable (not yet evaporated) primordial black hole (PBH) that could have survived until today has approximately the same size as a proton (Ref. 21). The large low-mass black dot in the SMBH (super massive black hole) range is the 4 × 10⁶ solar mass black hole at the center of our galaxy (Ref. 22), while the more massive large black dot is Ton 618. The dashed horizontal line at m=mp emphasizes the orthogonal symmetry of black holes (m∝r) and particles (m∝r−1). Our Universe is represented by the “Hubble radius” and has a mass and size that places it on the black hole line, seemingly suggesting that our Universe is a massive, low-density black hole (Sec. III A). The black rectangle containing neutron stars (“NS”), white dwarfs (“WD”), and brown dwarfs (“BD”) indicates the size of the parameter space plotted in Fig. 3. Less comprehensive versions of this plot can be found at Refs. 20 and 23–28.
Thanks for linking the graph
That graph really is very impressive. I’ve always always wondered about the size scale in which most phenomena around us happen, but that very narrow isodensity area containing from viruses to main sequence stars is mind blowing.
Rad!
if we do live in a black hole then what are the black holes we observe? they’re not white holes
It’s like a giant tesseract
Black hole inception
It’s black holes … all the way down
i wonder what that would do to the matter/energy?


